Social and Community Analytics with Helika
Crypto and Web3 have been community-first industries since the beginning. The decentralization ethos plays a vital role here. Instead of central entities, we have networks of various stakeholders, for example, miners or validators. That extends to games and NFTs projects which require a strong supporter base to survive in the fast-paced attention economy that is web3. In this dynamic landscape, social media sentiment analysis has become a powerful tool.
Twitter and Discord are the Home of Web3 Communities
X (formerly known as Twitter) has become the main channel for reaching the core community of web3 gamers, which constitute the golden cohort for many apps and games. X is where players hear about new projects and the first thing they check. Your profile and what users write about you become the first impression of your brand. Therefore, it is crucial to consistently track your social media performance and analyze the sentiment associated with your brand through social media sentiment analysis.
After a user has examined X, they’ll hop into your Discord next to investigate the activity, the sentiment, and the responsiveness of the team. Discord is where communities form. Where NFT holders build relationships, players educate each other, or members hang out to have fun. Over time, members become loyal users, start giving product feedback and market insights, and help spread the word. Data can deliver valuable insights into the health of a Discord, identify good and bad members, and ultimately help to build a thriving community. This is where social analytics comes in.
Social analytics are based on a collection of data and metrics that measure your relationships with people inside and outside your existing community. They provide insights on two levels:
- Macro: Reach, engagement, and the general sentiment associated with your brand
- Micro: Which topics drive reach, engagement, and positive attitudes? Which members are strong pillars within the community?
Teams should look at a mixture of quantitative and qualitative data to drive better learnings of what’s happening (quantitative) and why (qualitative).
Communities are the kingmakers of web3. Negative sentiment can become a self-fulfilling prophecy.
Optimize Your Activities
First, get an overview of your performance to identify the general trend and potential outliers. These outliers give us insights into the types of content that work best.
On the charts, we can, for example, identify strong positive outliers in replies and retweets on December 18th.
Digging into the Stats Table, we find the responsible post – a giveaway.

It’s not surprising that a giveaway drives engagement, but let’s measure the impact it had. As mentioned above, the user journey usually looks like this:
- Check Twitter
- Join the Discord

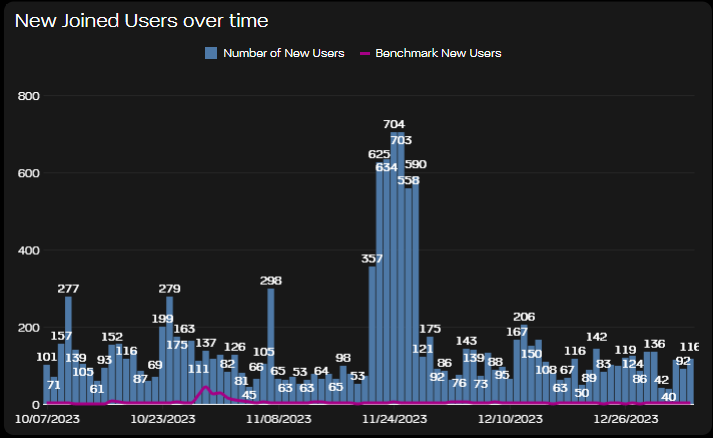
Consulting a chart with the number of new Discord users, December 18th looks like an average day. That could mean the giveaway mostly reached our existing community, which doesn’t have to be negative if it was the intended goal. It may have also tapped into new user groups on X but wasn’t enough to convince them to join our Discord. Next time, we may want to explicitly link to our server or even make “join Discord” a giveaway requirement. Lastly, the giveaway may have also reached users who aren’t really interested in our project and just want to farm prizes. A quick check of who engaged with our post helps form an opinion here.
Coming back to our performance stats on X, we can further determine the best days and hours to post.
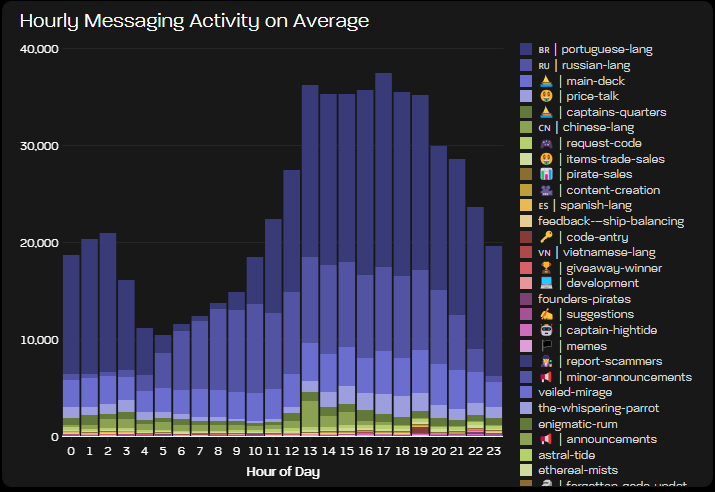
Be sure to publish similar types of content at different days and times for testing. You can use Discord or website data to inform your testing framework. For example, we can take our Discord activity as inspiration.

You may want to exclude overly positive and negative outliers, like the giveaway, to paint a more realistic general picture. For a few outliers, this can easily be done manually.
Advanced: Download the Twitter Stats as a csv file for more flexibility. For example, this allows you to easily evaluate stats per post (instead of per day), filter out outliers, group posts by content type, or calculate a 7-day moving averages of stats to better show trends over time.
To bring it home, you should analyze how your performance on Twitter and Discord affects your bottom line. Helika allows you to plot sales volume and Twitter engagement together to identify potential correlations.
Understand Your Community
There are two main categories to measure the health of your community
- Activity
- Sentiment
More activity is good but only if member contributions are valuable and positive. Seeing the number of messages increase because people complain about a bug is not what you want. Therefore, social media sentiment analysis provides an important context for activity data.
We can see that Discord activity jumped on Nov 24th (due to a new release) and stayed at a higher level for ~ 1 month until it decreased again around the Christmas holidays, which can be expected.
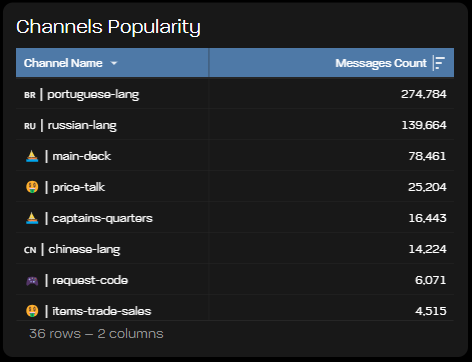
Discord data also helps us to learn more about our users. For example, we seem to have a large Portuguese-speaking user base, so we might want to reach out to influencers in that community, for instance.

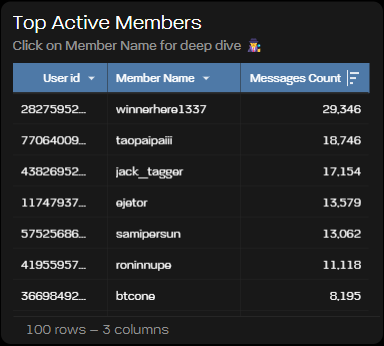
We can also identify community leaders. These are people who actively contribute to a positive feeling, help others, and provide us with valuable feedback. We should support them with resources (training, coaching, tutorials, wiki, templates) and make them feel appreciated as they are the glue that keeps the community together. They may even become team members, such as community managers.
Give people responsibility and authority. Start with small tasks. Divide tasks into manageable sub-tasks and give one person ownership.

After spotting who’s active, we can dig deeper to see how they engage on Discord. Are they just spamming or providing value? This way, we can also remove troublemakers before their toxicity spreads.
Sentiment on X is another important community indicator. It shows how satisfied the existing community is (retention). Furthermore, positive posts can bring in new users (acquisition).
Monitoring sentiment is the best form of crisis management. Seeing replies or external mentions slowly shift negative is a sign to jump in before things get out of control.
Sentiment also adds context to posts’ performance stats:
- Why do users like a post? Are they excited? Joyful?
- Why does a post have many replies? Are they positive or negative?
- Do people desire our NFTs?
Advanced: Download the Twitter Stats as a csv file to plot the number of mentions over time and analyze sentiment further (e.g. how do users express their excitement?). It also allows you to exclude irrelevant posts, for instance, ones that spam account tags.
Twitter mentions and Discord messages can provide you with a better understanding of how people perceive your product, which topics they’re most interested in, or what they would like to see improved. For instance, you may observe a lot of pre- and post-purchase chatter about your NFTs, meaning they are seen as a desirable asset.
Keep Your Finger on the Pulse
Competitor benchmarks have two use cases:
- Provide context for own performance stats
- Generate new insights
In a bull market, everyone’s numbers are increasing. Therefore, we have to consider competitor benchmarks to put our numbers into perspective. We want to outperform their growth to increase our share of voice. Attention is scarce and it’s usually the fastest horse that gets a majority of it.
Helika provides a benchmark natively in the dashboards (blue line). For example, we achieved above-average engagement in the past month.
We also see strong Discord activity compared to our benchmark and can be relieved that the decrease during Christmas is indeed normal.
Aside from Helika’s default benchmark, identify 5-10 main competitors and check their stats manually. This enables you to zero in on the most relevant benchmarks.
Advanced: Download the data as a csv file and plot your stats and multiple benchmarks in the same graph for easier comparison.
Competitor analysis can also help to determine what types of content work for them, identify your own content gaps, spot trends and narratives early, or pinpoint new target groups.
Conclusion
Social and community analytics allow you to understand your users, foster a healthy community that actively contributes to your project, and better reach new potential community members through socials.
Helika provides you with dashboards to analyze data and present your results effectively while you can go as deep as you want with the raw data that can be downloaded, too. Incorporate social media sentiment analysis into your strategy to gain valuable insights into user sentiments and further optimize your community engagement efforts.


