Helika Logo (2)

Why NFT Projects Need Data Analytics Pt. 1

banner 2

Why NFT Projects Need Data Analytics Pt. 1

banner 2

The golden rule of marketing is to understand your audience, and this is especially true for NFT projects. While there’s no marketing or community-building playbook for an NFT project, the role of data analytics in driving informed business decisions remains the same between Web2 and Web3.


Here are 3 different reasons why data analytics are necessary to stay competitive in the rapidly evolving NFT landscape.

1. Better Understand Your Audience

For NFT projects, understanding your audience means understanding your holders. But your holders change daily; NFTs are sold day in and day out, switching hands. And when they do, you often have a new holder.

Data analytics platforms like Helika help you easily monitor the perpetual changes to your holder base by using on-chain data to track new, returned, and lapsed holders.
The three types of holders: New, returned, and lapsed. These are an NFT project’s bread and butter for understanding project performance.
You can also get a simple, at-a-glance overview of your unique and cumulative holders over time to monitor holder concentration and growth rate, respectively.
Helika’s NFT data analytics platform is built to provide both high-level overviews and deep-dive analysis.
Knowing how many users, and what kind of users, are entering and exiting your NFT project’s ecosystem is critical for measuring success over time. This is one of the most basic, but important, metrics to start with when diving into the data behind your NFT project.

2. Find What Moves the Needle, and by How Much

NFT projects are in the business of creating experiences: An anticipated NFT drop, like a new collection for the BAYC community, or the launch of a new event, like the auction for golden skateboards embedded with Azuki’s Physical-Backed Tokens. These experiences generate buzz—and new holders/community members.


NFT data analytics can provide you with in-depth insights into cohorts (the sum of new and returned holders) within a certain time period. The goal: To help you understand how advancements in your project impact your churn and retention rate. Here’s how you can use this data:

Each cohort refers to the sum of new and returning holders over a specific period to track how long they stay in the ecosystem.

In the above screenshot, you’ll see that World of Women saw large spikes in cohort count in July, August, January, and March.


The first two months can be attributed to the emergent launch of a new and popular NFT project, but what happened in January and March?


January: World of Women announced the hiring of Guy Oseary as the project’s manager and changes to their IP rights to provide holders with full ownership rights over their NFTs.


March: World of Women launched WoW Galaxy, a new NFT collection that was given to existing WoW NFT holders.


In each case, there is a clear correlation between an increased cohort count (an influx of new and returning holders) and these announcements. By continuously monitoring the impact of different initiatives your NFT project is running, you can see what moves the needle and what doesn’t, and then adapt accordingly.

3. Examine the On-Chain Finances

There are two primary ways that NFT projects monetize: They launch a collection and then they earn royalties on those collections. However, royalties are controlled by individual marketplaces and depend on the trading velocity of your project’s NFTs. This makes it important for an NFT project to understand the market behavior of their NFTs, and the user behavior that drives it.

NFT data analytics are useful for examining the many factors that concern your treasury: the transaction volume for your project’s NFTs, the marketplaces they’re transacted on, and how much your project is earning (or not earning) in royalties.
Blog1_Chart4 1 (1)
A snapshot of your NFT project’s on-chain financials in 20 tiles.
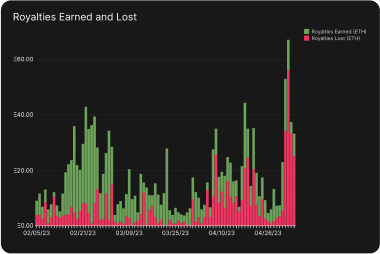
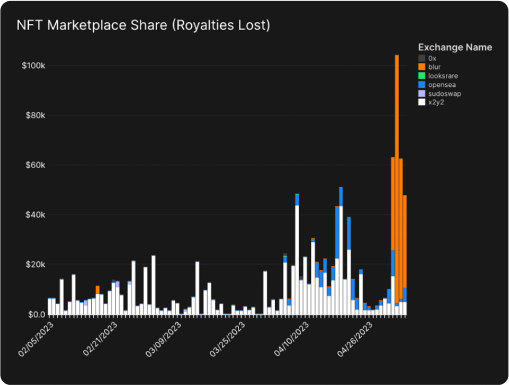
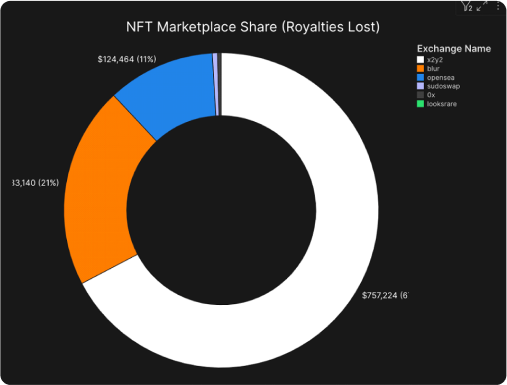
For example, a particularly useful metric to examine is royalties lost. This refers to royalties that NFT holders avoid by trading on a different marketplace with lower (or no) royalties.

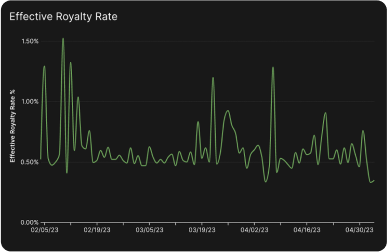
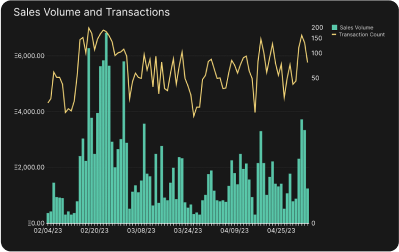
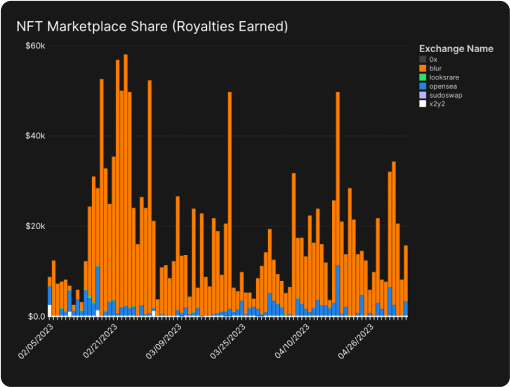
By using the advanced NFT data analytics provided by Helika, you can easily see the royalties your project is earning or losing daily, the sales transactions and volume behind the royalty earnings, and view the effective royalty rate for your project (volume/royalties).
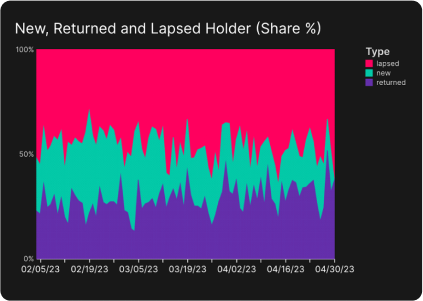
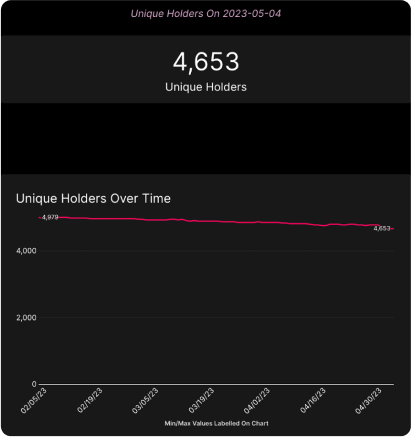
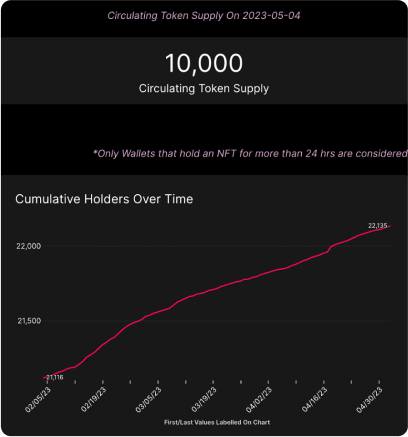
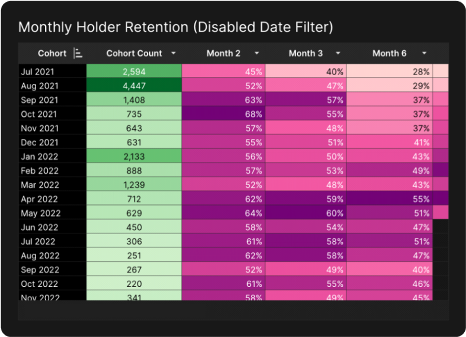
Ready-made charts on Helika provide you with crystal-clear data visualizations that can inform business decisions.

But where are your holders transacting and on what marketplaces are they avoiding royalties? This is particularly important information for NFT projects that want to better manage their treasuries and make sound decisions around their royalty enforcements. For example, if a particular marketplace generates millions of dollars in lost royalties, should the project blacklist it? Or consider creating their own marketplace where they can control royalty enforcement?


In the Azuki data dashboard below, the largest culprit of Azuki’s lost royalties is X2Y2; More than 60%+ of lost royalties come from X2Y2 transactions of Azuki NFTs. But in the daily chart, Blur has recently overtaken X2Y2 in proportional royalties lost—signaling that more and more royalties will be lost through Blur if recent trends continue.

Each cohort refers to the sum of new and returning holders over a specific period to track how long they stay in the ecosystem.

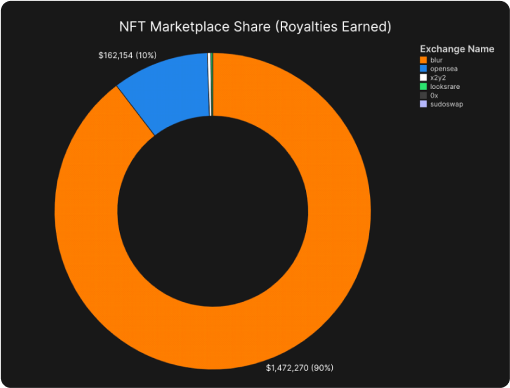
At the same time, Blur’s transaction volume and sales count dominate when compared to other marketplaces, and it is the leading royalty generator by sheer numbers.
Given this data, it’s likely that Azuki should not blacklist Blur despite the increase in royalties lost, because Blur is the leading marketplace platform for Azuki traders by a significant margin. However, the Chiru Labs team may want to consider blacklisting X2Y2, which has relatively little volume and accounts for a disproportionate amount of lost royalties.

Make Informed Decisions

Given this data, it’s likely that Azuki should not blacklist Blur despite the increase in royalties lost, because Blur is the leading marketplace platform for Azuki traders by a significant margin. However, the Chiru Labs team may want to consider blacklisting X2Y2, which has relatively little volume and accounts for a disproportionate amount of lost royalties.

ABOUT HELIKA

Helika is a web3 technology platform that delivers real-time analytics and onboards new users to gaming studios and popular NFT collections. With a focus on integrated analytics from Web2, in-game, on-chain and social media data, Helika helps top Web3 brands such as Yuga labs and Treasure to understand their communities, increase user acquisition and engagement, and drive overall growth with a data-driven approach.

Helika is backed by top VC firms including Diagram Ventures, Sfermion, Sparkle Ventures, Big Brain Holdings, Fenbushi and Builder Capital.

For more information, visit helika.io
We are onboarding select Studios to our platform. Drop your information here and we’ll be in touch soon.